Trading Cryptos With Quantguy!
We've discussed trading with my indicators in previous articles like this one, and this one. But so far, although our focus has been on cryptos, we have used the momentum indicators (long term and short term) and the Kovach Reversals Indicator. Here, we discuss the Altcoin Index and the Crypto Spread Indicator, and how to use these to trade cryptos. If you don't have the attention span to read a blog post, I've also made a YouTube video on the topic.
The Indicators
Let's discuss the indicators themselves. Here, we are focusing on the Crypto Indicators. Let's start with the Altcoin Index.
In geneneral, market indexes are calculated as the weighted sum of several components. For example, the S&P 500 index is calculated by summing the prices of the top 500 US companies weighted by their market capitalization. Here, the Altcoin Index is calculated by summing the values of the top Altcoins, weighted by their market capitalization. Since these values change often, the index is updated weekly.
Next, we have the Crypto Spread Indicator, which measures the difference in returns from investing in Bitcoin vs. the Altcoins in the Altcoin Index. Positive values indicate that Bitcoin is providing better returns, while negative values show us that Altcoins are more profitable. When one is providing better returns, it may indicate that the other is more competitively priced. Finally, when this indicator reaches an apex, it might be time to consider taking profits from one and allocating funds to the other.
Trading
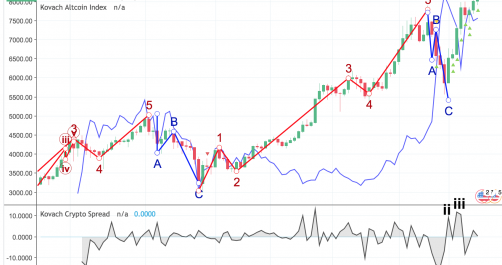
In the chart that accompanies this article, we see the price of Bitcoin (candlestick chart) overlaid upon the Altcoin Index (blue line chart). We also have the Elliott Wave drawn over BTC. We'll talk about Elliott Wave and its application to cryptocurrencies in a future post.
Observe that during Bitcoin's retracement (the 'corrective' ABC wave in the chart), the Altcoin Index reached an apex. Correspondingly, the Crypto Spread Indicator also reached a minimum (Roman numeral 1). Recall that when the index is below zero, this indicates that Altcoins are providing better returns than Bitcoin. This makes sense, because at that point Bitcoin had a large correction. At this point it would make sense to by Bitcoin (on the dip). We were rewarded for this by the subsequent rally.
No winning trade is complete without taking profits. We could use the points illustrated by roman numerals 2 and 3 to get a feel for when Bitcoin has reached a point where we can comfortably take profits.
Conclusion
In this article, we discussed ways that a trader can maximize returns between cryptocurrencies by using the Quantguy crypto indicators. We introduced the Altcoin Index, which is a weighted sum of all the major altcoins, and the Crypto Spread Indicator, which measures the difference in returns between the index and Bitcoin. Using this indicator, we can determine when either BTC or the Altcoins are more competitively priced. Also, we can determine entry and exit opportunities in each using the peaks and valleys in the Crypto Spread Indicator.