These changed my trading for the better!
The Indicators
Error message
- Notice: Trying to access array offset on value of type int in element_children() (line 6592 of /home4/kovachte/public_html/quantguy/includes/common.inc).
- Notice: Trying to access array offset on value of type int in element_children() (line 6592 of /home4/kovachte/public_html/quantguy/includes/common.inc).
- Notice: Trying to access array offset on value of type int in element_children() (line 6592 of /home4/kovachte/public_html/quantguy/includes/common.inc).
- Notice: Trying to access array offset on value of type int in element_children() (line 6592 of /home4/kovachte/public_html/quantguy/includes/common.inc).
- Notice: Trying to access array offset on value of type int in element_children() (line 6592 of /home4/kovachte/public_html/quantguy/includes/common.inc).
- Notice: Trying to access array offset on value of type int in element_children() (line 6592 of /home4/kovachte/public_html/quantguy/includes/common.inc).
- Notice: Trying to access array offset on value of type int in element_children() (line 6592 of /home4/kovachte/public_html/quantguy/includes/common.inc).
- Notice: Trying to access array offset on value of type int in element_children() (line 6592 of /home4/kovachte/public_html/quantguy/includes/common.inc).
- Notice: Trying to access array offset on value of type int in element_children() (line 6592 of /home4/kovachte/public_html/quantguy/includes/common.inc).
- Notice: Trying to access array offset on value of type int in element_children() (line 6592 of /home4/kovachte/public_html/quantguy/includes/common.inc).
- Notice: Trying to access array offset on value of type int in element_children() (line 6592 of /home4/kovachte/public_html/quantguy/includes/common.inc).
- Notice: Trying to access array offset on value of type int in element_children() (line 6592 of /home4/kovachte/public_html/quantguy/includes/common.inc).
- Notice: Trying to access array offset on value of type int in element_children() (line 6592 of /home4/kovachte/public_html/quantguy/includes/common.inc).
- Deprecated function: implode(): Passing glue string after array is deprecated. Swap the parameters in drupal_get_feeds() (line 394 of /home4/kovachte/public_html/quantguy/includes/common.inc).
- Deprecated function: The each() function is deprecated. This message will be suppressed on further calls in _menu_load_objects() (line 579 of /home4/kovachte/public_html/quantguy/includes/menu.inc).
We are driven by our vision
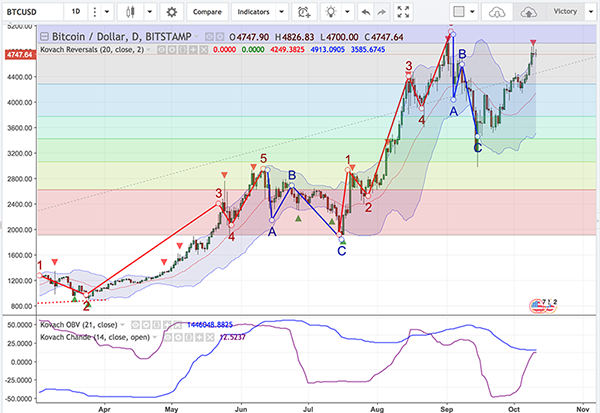
How can one determine when a correction is likely to occur? We need more technical facts to build a case. Candlestick reversal patterns are another aspect we can use. When reversals occur, typically there is a telling formation with the candlesticks that acts as confirmation.
By painstakingly hand coding a list of these candlestick reversal patterns, I’ve added a secondary confirmation when we see encroachment on a Bollinger band combined with a candlestick pattern.
This can be used to predict corrections, or portend momentary dips in a trending market to add to enter a position or add to one.
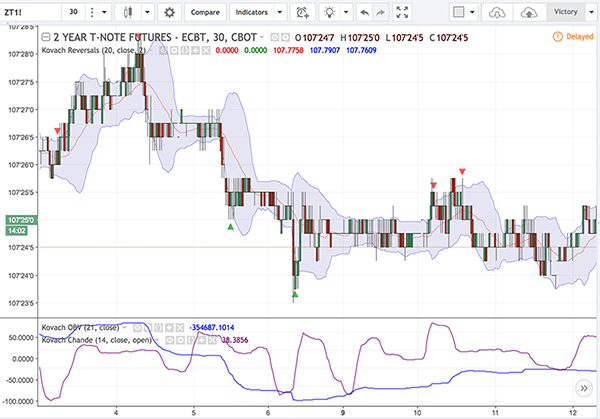
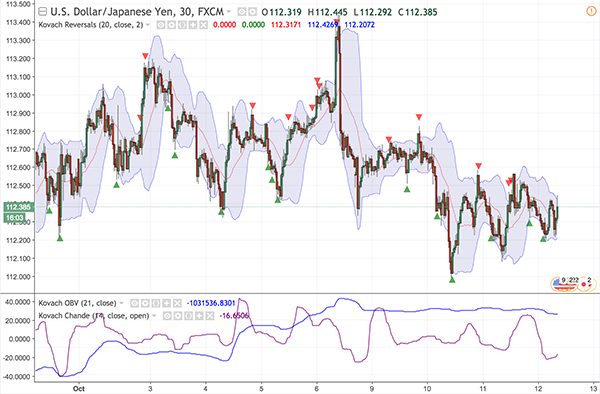
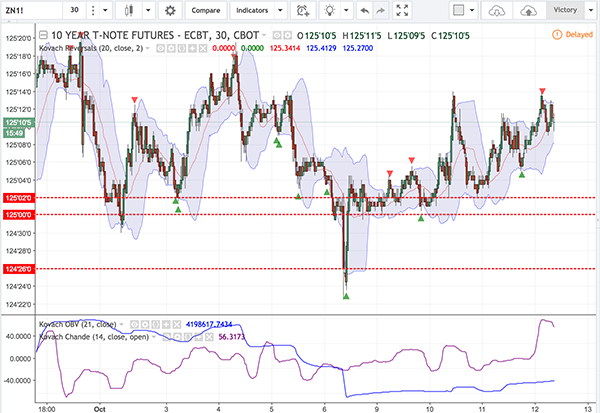
The Momentum Indicators
The three momentum indicators are:
- Kovach Momentum – measures very short term momentum ‘spikes’
- Kovach Chande – measures mid term momentum
- Kovach OBV – measures long term momentum
Using a combination of the above, a user can ascertain the overall trend (using the long term momentum), and the retracement (using the shorter term momentum). This is highly valuable to identify optimal entry points. One never wishes to buy at highs, for example. Optimally, one would wait for momentum to recede, and the price to pullback to enter a trade.
These indicators can overlay on top of a chart, or (preferably) reside in their own window below the main chart window.
The Reversals Indicator
Finally, the reversals indicator, Kovach Reversals, consists of two key concepts:
- Bollinger Bands
- Candlestick Reversals
Bollinger bands measure volatility by calculating the standard deviation. Based on statistics, one can anticipate corrections to the down side when the price encroaches on the upper Bollinger Band, and corrections to the upside when the price encroaches on the lower Bollinger Band. This is not the case in strongly trending markets.
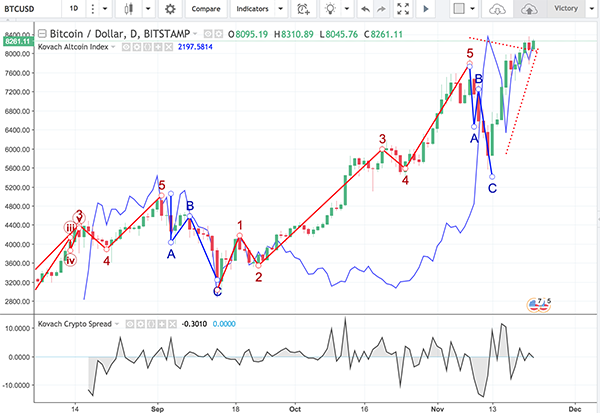
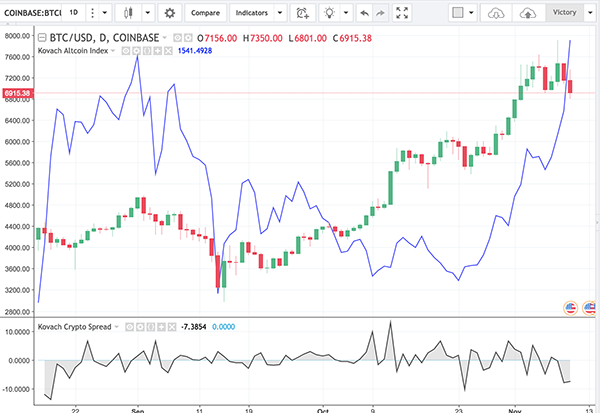
Quantguy Crypto Indicators
(NOW INCLUDED IN PACKAGE!)
Kovach Altcoin Index
This index is a weighted average of the top 5 altcoins by market capitalization.
Since this changes often, the index is updated weekly. You can think of it as the S&P 500, but for altcoins.
Itʼs extremely useful to get & feel for the flow of funds between bitcoin and the other altcoins.
Kovach Crypto Spread
With the Kovach Crypto Spread, we can visualize the returns on Bitcoin vs the top altcoins by market capitalization. Since the market capitalization changes frequently, this indicator is updated weekly.
If the indicator is in positive, bitcoin is providing better returns than the altcoins.
If the indicator is negative, the converse is true.
Testimonials from Real Traders
Subscribe to our Indicators
Copyright ©2017 QuantGuy • All Rights Reserved.