
How to Trade the Breakout
As I predicted here and here, Bitcoin finally broke out from the bull flag pattern it has been forming over the past few days. The purpose of this post is to tell you how I was able to predict this.
First, the bull flag pattern is fairly well established in trading. It represents a consolidation pattern following some initial upside momentum. Consolidation patterns usually precede breakouts. This is because consolidation implies a concentration of liquidity about a particular level, which suggests that liquidity is drawn from surrounding levels, forming what we call a 'vacuum zone'. When the price tests a vacuum zone, it tends to move through it very quickly. This is what we call a 'breakout'.
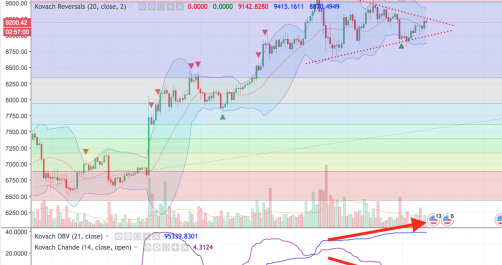
Now for more confirmation that the price would break to the upside in particular. Using my technical indicators, I was able to determine that the long term momentum (blue line) was strong, but the short term momentum (purple line) had let up for a bit. The two things that must revert to the mean are volatility and momentum. The latter occurs because investors, as deep as their pockets may be, have finite capital, and have to take their foot off the gas at some point. Typically this results in a dip, or consolidation pattern (e.g. a wedge or flag), before another breakout.
To recap: we combined three facts to make this trade:
- Overall faith that the crypto markets have come back to life
- Bull wedge pattern
- Divergence between the Kovach OBV (blue line) which measures long term momentum, and the Kovach Chande (purple line) which measures short term momentum