Thoughts on Stocks: SPY
SPY is quite bullish. There are many technical indications of strength, but it would be wise to wait for a better price, rather than buying and getting caught in a retracement.
At the time of this writing, SPY was trading at $291.45.
Levels from above will provide resistance, including:
291.74 from highs and lows over the past 14 periods
Levels from below will provide support, including:
289.60 from volume profile over the past 14 periods
288.44 from volume profile over the past 30 periods
286.76 from volume profile over the past 14 periods
285.97 from volume profile over the past 30 periods
283.73 from volume profile over the past 100 periods
283.03 from volume profile
281.28 from volume profile over the past 100 periods
279.88 from volume profile
278.77 from volume profile
278.01 from volume profile over the past 100 periods
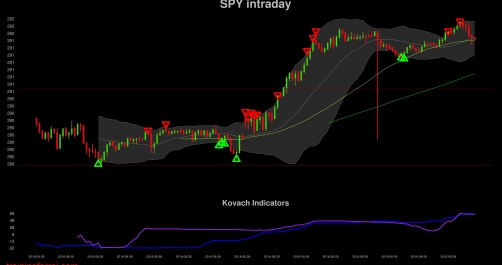
Lets look at some technical analysis for SPY. Volatility has consolidated quite a bit, expect a breakout soon. The RSI is 73, which suggests that we are in a bull trend, but not overbought. The MACD is above the signal line, but not by too much, suggesting that we are in a bull trend which may continue. SPY is above the 50 period SMA by quite a bit, suggesting that we are overbought. Further, SPY is substantially above the 100 period SMA, which is at 276. This indicates that SPY is overbought. Finally, the 50 period SMA is above the 100 period SMA, indicating longer term bullish confirmation. The ADX indicator, at a value of 38 conveys a modest bull trend.
Currently, SPY is above the central moving average of the Kovach Reversals Indicator, which sits at about 285. However, it is getting closer to the upper bound of this indicator at 291, which will provide resistance.