Neo Getting Crushed
Although the technicals for neo seem to be bearish, we don't have a lot of conviction.
neo is trading at $18.49, at the moment.
Levels from above include:
23.09 from sma 50
25.03 from highs and lows over the past 14 periods
57.80 from highs and lows over the past 100 periods
94.76 from highs and lows
Levels from below include:
17.47 from highs and lows over the past 14 periods
14.12 from highs and lows over the past 30 periods
Lets look at some technical analysis for neo. Volatility is much lower than average, so a breakout can be expected. An RSI value of 43 suggests that we are in bear mode but not oversold yet. The MACD suggests that we are in a bearish phase, but that we are not oversold, yet. neo is below the 50 period SMA, which indicates a bear trend, but not oversold yet. The 100 period SMA indicates that we are in a bear trend. Finally, the 50 period SMA is below the 100 period SMA, indicating longer term bearish confirmation. The ADX indicator, 10 suggests that neo is ranging.
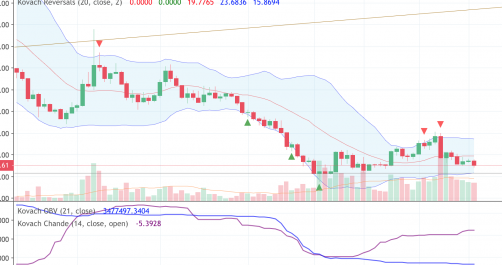
Currently, neo is near the central moving average of the Kovach Reversals Indicator, which sits at about 19.58. It still has some room between current prices and the lower bound of this indicator at 15.61, which will provide support.
Bull Score: 0 Bear Score: 5 Ranging Score: 2