Litecoin Analysis
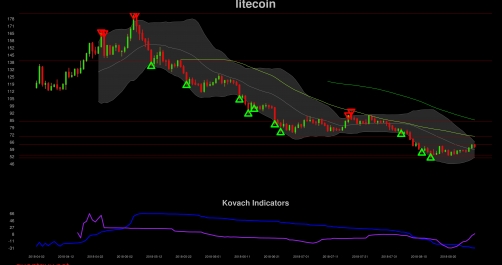
The technical analysis for litecoin is somewhat bearish. There isn't a lot of conviction here so be careful when entering a trade.
Currently, litecoin is trading at $61.77.
We will find resistance from levels from above including:
63.40 from highs and lows over the past 14 periods
71.05 from sma 50
84.71 from highs and lows over the past 30 periods
139.64 from highs and lows over the past 100 periods
182.88 from highs and lows
We will find support from levels from below including the following:
53.77 from highs and lows over the past 14 periods
51.16 from highs and lows over the past 30 periods
The technicals for litecoin are as follows. Volatility is much lower than average, so a breakout can be expected. The RSI indicator suggests that we are in a bear trend, but not oversold yet. The MACD suggests that we are in a bullish phase but not overbought yet. The 50 period SMA indicates that we are in a bear trend. Also, litecoin is below the 100 period SMA, indicating a bear trend. Finally, the 50 period SMA is below the 100 period SMA, which is a longer term confirmation of bearishness. The ADX suggests that litecoin is ranging.
Currently, litecoin is near the central moving average of the Kovach Reversals Indicator, which sits at about 59. It still has some room between current prices and the upper bound of this indicator at 66, which will provide resistance.