Bitcoin Testing the Low of The Range
bitcoin shows bearish signs, but they're not overwhelmingly strong. Read further for more technical analysis.
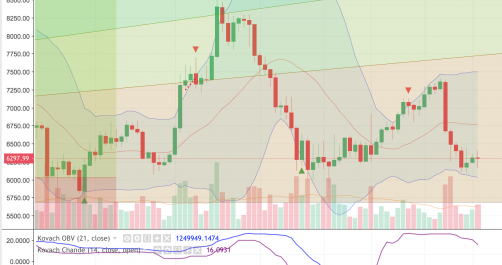
Currently, bitcoin is trading at $6330.00.
Levels from above will provide resistance, including:
6900 from volume profile over the past 14 periods
6974 from sma 50
7061 from volume profile over the past 14 periods
7115 from volume profile over the past 14 periods
7186 from volume profile over the past 14 periods
7246 from volume profile over the past 14 periods
7299 from volume profile over the past 14 periods
7388 from volume profile over the past 14 periods
8424 from highs and lows over the past 100 periods
9964 from highs and lows
We will find support from levels from below including:
6198 from highs and lows over the past 14 periods
5971 from highs and lows over the past 30 periods
5826 from highs and lows over the past 100 periods
As for Technical Analysis we have the following. Volatility is much lower than usual, anticipate a breakout soon. An RSI value of 39 suggests that we are in bear mode but not oversold yet. The MACD suggests that we are in a bearish phase, but that we are not oversold, yet. The 50 period SMA indicates that we are in a bear trend. Additionally, bitcoin is below the 100 period SMA, which indicates a bear trend, but not oversold yet. Finally, the 50 period SMA is above the 100 period SMA, which is a longer term confirmation of bullishness. The ADX indicator suggests a bear trend, at 28.
Currently, bitcoin is above the lower bound of the Kovach Reversals Indicator, at 6039. This should provide support. The central moving average of the KRI will provide resistance at 6747, if momentum reignites.
Bull Score: 1 Bear Score: 5 Ranging Score: 0