Bitcoin Rangebound
Although Bitcoin has taken a relatively large plunge in the past 24 hours, there is little evidence that this is anything other than another 'Bart Simpson' pattern. As I've written in a previous post, there isn't a lot of liquidity or volume in the crypto markets. Most of the weaker HODLers have been washed out, and any serious investors are in it for the long haul.
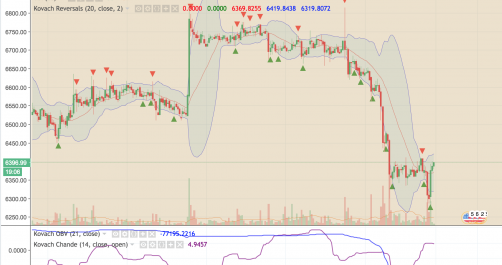
On the technical side, on day charts, we see that BTC is near the central moving average of the Kovach Reversals Indicator, which seems to be providing support. On the 30 minute chart, the Kovach OBV, which measures long term momentum has dipped drastically. This is normally a 'sell' signal, especially when the Kovach Chande has picked up. But the Kovach OBV has leveled off for now, indicating that the gas has let up on the sell side. Anticipate more ranging but we can safely assume action will return to the buy-side soon. For more information about the indicators, check them out here!