Litecoin Pummeled, Testing Support
litecoin shows bearish signs, but they're not overwhelmingly strong. Read further for more technical analysis.
At the time of this writing, litecoin was trading at $54.60.
Levels from above include:
66.00 from sma 50
68.98 from highs and lows over the past 14 periods
127.37 from highs and lows over the past 100 periods
182.88 from highs and lows
We will find support from levels from below including the following:
52.58 from highs and lows over the past 14 periods
51.16 from highs and lows over the past 30 periods
Lets look at some technical analysis for litecoin. Volatility is much lower than average, so a breakout can be expected. The RSI is 39, which suggests that we are in a bear trend, but not oversold. The MACD suggests that we are in a bearish phase, but that we are not oversold, yet. litecoin is below the 50 period SMA, indicating a bear trend. Additionally, litecoin is below the 100 period SMA, which indicates a bear trend, but not oversold yet. Finally, the 50 period SMA is below the 100 period SMA, indicating longer term bearish confirmation. The ADX indicator, 25 suggests that litecoin is ranging.
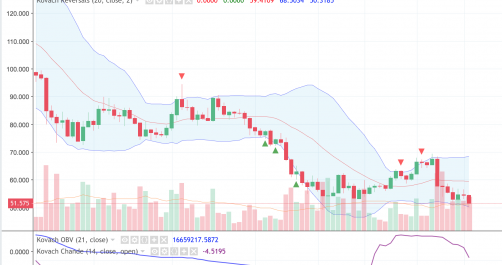
Currently, litecoin is above the lower bound of the Kovach Reversals Indicator, at 50.9. This should provide support. The central moving average of the KRI will provide resistance at 59.18, if momentum reignites.
Bull Score: 0 Bear Score: 5 Ranging Score: 2