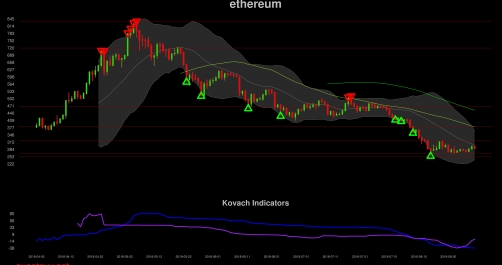
Ethereum Bearish
Ethereum is bearish, but we don't have much confirmation. Use caution when trading this product.
Ethereum is trading at $289.31, at the moment.
Levels from above include:
320.45 from highs and lows over the past 14 periods
382.61 from sma 50
467.95 from highs and lows over the past 30 periods
719.28 from highs and lows over the past 100 periods
835.06 from highs and lows
We will find support from levels from below including the following:
265.00 from highs and lows over the past 14 periods
254.65 from highs and lows over the past 30 periods
Technical analysis for ethereum is as follows. Volatility is much lower than usual, anticipate a breakout soon. The RSI is 39, indicating that we are in a bear trend, but not yet oversold. The MACD is above the signal line, but not by too much, suggesting that we are in a bull trend which may continue. ethereum is below the 50 period SMA, which indicates a bear trend, but not oversold yet. Additionally, ethereum is under the 100 period SMA, which is currently at 452, indicating bearishness. Finally, the SMA(50) is below the SMA(100), a long term bearish confirmation. The ADX does not indicate a trend, i.e. we are ranging.
We are below the central moving average of the Kovach Reversals Indicator at 302, and fairly close to it. If we lose momentum, we'll have support from the lower bound of the KRI at 240.